Multiple versions of Python

Do you have multiple versions of Python to be installed? Do you have additional python packages that must be used in separate versions of Python installed on the system?

Use Virtual Environments!

Today we will see how to setup 2 different versions of Python environment.

  • Install python

    sudo apt install python

  • Install pip (python’s package management system):

    sudo apt install python-pip

  • Upgrade pip:

    pip install –upgrade pip

  • Install virtualenvwrapper by running this command:

    pip install virtualenvwrapper

  • Before we can create a virtualenv, we need to run the virtualenvwrapper script. We can find the location of virtualenvwrapper script by running the following command:

    which virtualenvwrapper.sh

  • Execute the script as:

    source ~/.local/bin/virtualenvwrapper.sh

  • Make a virtual environment with following command

    mkvirtualenv -p <location of python3.5> <name_of_env>

    For example for creating virtual env for python 3.5 named ‘venv35’, run:

    mkvirtualenv -p python3.5 venv35

    It will take activate the virtualenv for us directly. To deactivate it, enter:

    deactivate

  • Similarly, we can create another environment for python 2.7 named ‘venv27’, run:

    mkvirtualenv -p python2.7 venv27

  • To run, any environment, run the command:

    workon <env name>

    For exaemple, to run venv27, use:

    workon venv27

Enjoy!

Powershell Running Scripts (PS1) Error

When running some ps1 file in Powershell and you get some error like:

File <Path-to-some-ps1-file>.ps1 cannot be loaded because the execution of scripts is disabled on this system. Please see “get-help about_signing” for more details.

You can solve it by running the following command in Powershell:

Set-ExecutionPolicy -Scope "CurrentUser" -ExecutionPolicy "RemoteSigned"

To reset the policy setting run:

Set-ExecutionPolicy -Scope "CurrentUser" -ExecutionPolicy "AllSigned"

Cheers!.

VirtualBox on Windows (Host)

Hi there!

In this post, we will setup VirtualBox on Windows with Linux as a Guest OS. Follow the steps to begin:

Downloading and Installing VirtualBox

Download the virtual box setup from here. Under VirtualBox binaries, select package for Windows Hosts. Also, download VirtualBox Extension Pack, we will need it later for when we setup our Guest OS.

Also we need to download our favorite Linux distro. I am using Ubuntu latest version (as of this date), you can get it from here.

We will run VB setup wizard and install VirtualBox on our drive (you can specify the location where you want to install it).

Install Extension Pack

Run VirtualBox for the first time. Go to File > Preferences or use shortcut key (Ctrl + G). In the Preferences dialog box, go to Extensions.

Add the extension pack that we downloaded earlier. We can do so by either Right Click > Add Package or pressing the button (Add New Package) on the right hand side of the window.

Once weagree to the terms of conditions, we’ll able to install the extension pack.

Press Ok to close the Preferences dialog box.

Creating a New Virtual Machine

Click on New button to create a new virtual machine (VM). It will open up a wizard to create a VM. Enter the name for our VM (I’m using ‘Ubuntu 16.04.2’ same as the version of my Ubuntu). Click Next.

Select the amount of RAM we want to assign to this VM. I’ve assigned 8GB as I have 32GB but you can assign as per your preference. Click Next.

It will ask us whether we want to add virtual hard disk to this machine or not. We will make sure to select ‘Create a virtual hard disk now‘ option before we click Create button. Select the size of the hard disk and then we are done.

Installing OS on VM

Right click on the VM we just created and select Settings. In General Settings, go to Advanced tab, change ‘Shared Clipboard‘ and ‘Drag’n’Drop‘ to Bidirectional.

In Storage settings, we can see that under Controller: IDE it shows Empty. Select this Empty option and we will see that Attributes on the right hand side changes. Click on the CD icon next to the Optical Drive option and select the Choose Virtual Optical Disk File option to choose Ubuntu Iso we downloaded.

Check Live CD/DVD option below that as well. And then Press Ok to close the Settings.

Start the VM by right clicking and selecting the Start > Normal Start.

Now we can install Ubuntu on this Machine.

Setting things in Ubuntu (Guest)

Once we have installed Ubuntu on our VM, we will start it. Now go to Devices > Insert Guest Additions CD Image. It will ask to run, then enter your password to install it. Then restart Ubuntu after it is installed.

Go to Devices > Shared Folders > Shared Folders Settings. Right click and then select Add Shared Folder. Select the folder path that we want to share. Make sure you select Auto mount and Make Permanent and press Ok.

Shut down the Ubuntu OS.

Restart your VM, and voila your system is ready with Shared Folder

Note: If you get Permission denied error on accessing the shared folder, just add your username to vboxsf group using command:
sudo adduser <username> vboxsf

Statistics – Part 2

In this post, we’ll cover Mean, Median and Mode. We’ll keep them to the point and will not go deep down into them in this series.

Mean
There are three different types of means

  • Arithmetic mean
  • Geometric mean
  • Harmonic mean.

For this series we’ll cover arithmetic mean only. I’ll refer to arithmetic mean as mean.

In simple words, mean is average. But average of what?
We’ll get into that but take a look at a following table of Players’ scores:

Players Scores
15 35 85 55 95 65
45 20 25 60 80 20

These are scores of 12 players for some game they played.

So, now if we want to know ‘what is the score that is achieved averagely by the players?’ we can simple get an average of all the observed values. (Remember data set is a set of values)

Average = sum of all observations / total number of observations 

Now, we have
total observations = 12, and
sum of all observations = 15 + 35 + 85 + ….. + 80 +20 =  600

Therefore, Mean = 600 / 12 = 50

This concludes that the average score that players achieve in the game is 50.

But that only tell us about the overall info about that data. What if we want to know much more detail about that? What if we want to know if the game was difficult or easy? How can we deduce that from out data set?

This brings us to our next topic.

Median
Median is the mid point of our data.

To observe the mid point we need to organize our data from low score to high score. Take a look at the following table:

Ordered Players Scores
Player Score Player Score
1 15 7 55
2 20 8 60
3 20 9 65
4 25 10 80
5 35 11 85
6 45 12 95

Median is calculated using the total number of observations. Median is a value which lies in the mid of all the values. We have 12 observations. What is the mid point of these values? Well it is difficult to say, since there is no single value that fulfills this criteria. Now, only if it had been 13 total observations, then we could have said value number 7th value is the median. Then this would have been our expression:

Median = value at (n + 1 ) / 2
where n = Total number of observations

But we have 12 total values, this makes it a problem. If we use the above formula we’ll get 6th value as our median which does not makes sense as 6th value doesn’t lie in the middle of the data.
How can we get the median for this?

If we observe the table again we can see that 6th and 7th values lie in the middle but neither of them are true medians. To solve this dilemma, just take an average of these both values.
6th value = 45
7th value = 55
Their average = (45+55)/2 = 100/2 = 50

So, we can say that in case of even number of observations, our formula is as:

Median = (value at ‘a’ + value at ‘b’)/2
where n = Total number of observations,
a = n/2,
b = (n+1)/2

We got a median value as 50, therefore we can see that the game is neither easy nor difficult.

Now most of the times you see a data set, you can observe that certain data values are repeating. This triggers a question, what value is the most common?
This brings us to our last topic Mode.

Mode
Mode is a data point that occurs with high frequency in the data set. To put it simply, the data value that appears most often in the data set is Mode.

Frequency of scores
Score Frequency Score  Frequency
15 1 55  1
20 2 75  1
25 1 80  1
35 1 85  1
45 1 95  1
50 1

We can see that 20 is the score that occurs 2 times in our data set. This is our mode.

Easy. Right?

Yes, but make sure to take care of following points while finding the mode.

  • Mode does not have a minimum frequency;
    • Suppose the following data set is there
      1,4,5,5,3,6,8,2,7,8,9,0
      And another data set
      1,4,5,5,5,5,3,6,8,2,7,8
      We can observe that in the first data set, 5 occurs twice and in the second data set 5 occurs 4 times. In both cases, the mode is 5.
      However in the second case the 5 is the most common value whereas in first case it could be a ‘by-chance’ situation. Always make a smart observation. Frequency matters for any data set values.
  • Multiple modes can be there for a single data set;
    • Suppose the following data set is there
      1,4,4,4,5,3,6,6,6,8,2
      We can observe that 4 and 6 occurs three times. Therefore, 4 and 6 both are our modes.

So we have seen how mean, median and mode can help us evaluate our data in different contexts and answer some questions that would have been very difficult to answer. Add in a good representation such as histograms, we get a good idea what is going on with out data.

We’ll study some other concepts that are useful in statistics in future posts.
Statistics – Part 1

Statistics is a study of methods for data collection, analysis, and interpretation, and principles of experimental design.

What is Data?
Data is any set of values. It could be qualitative or quantitative. In a simple words, data is collection of values or numbers or anything that gives some sense of information.

Is data good or bad?
Well to put it simply, data can be both. If we can get some useful information from that data, deduce something by going through it, then data is generally considered good.
But is it really so?
Even the good data can still be further classified as good or bad. Confusing, isn’t it?

Think about these questions:
How much of that data is useful?
Is it valuable?
What is the quality of data?
Is the data biased? 

You got the gist, right? When we ask these questions we slowly begin to understand whether data is good or not.

How is data collected?
The data is collected through observations and measurements.

What type of data is there?
Data can be broadly divided into 2 parts:

  • Primary data (collected by us)
  • Secondary data (collected by others)

What is importance of organised data?
Organised data help us to understand it more easily. We save time and money. It allows us to make good decision. It helps us work with precision.

How do we represent data?
There are many ways that data can be represented. The most common of them all are:

  • Tables
  • Charts
  • Graphs

There are several other ways to plot our data such as dot plot, histogram, pie charts, etc. We’ll go through these in upcoming posts.

Made a Game for GameJam

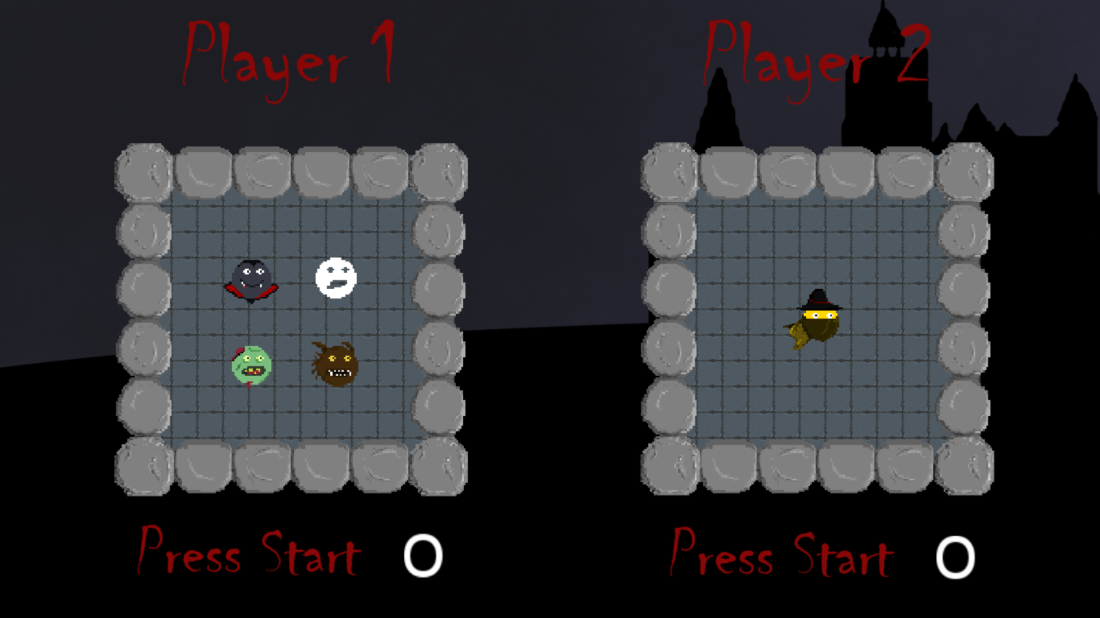
So last month I participated in a 48-hour game jam in my University. I was in a team of 5 people. The theme of the game jam was “You are villain”.

We discussed about the theme and decided that we should make it simple yet fun.

We wanted to create something that everyone can relate with. And what better game than the classic Pacman. We thought let us give our players the ability to control the ghosts. It sounded nice but how to go about it? Which ghost should we let the player control? Instead of picking one of the ghosts we picked all.

Yes, you read that right all of the ghosts could be controlled by the player.

But now it begs the question of how to control all of them? Let the user switch between them through buttons? That was one solution but we went nuts and let the player control all the ghosts simultaneously. Yep, we were going to let the player manipulate all the ghosts from a single controller.

We used Xbox controller and use left thumbstick, right thumbstick, directional pad and 4-buttons(A, X, B, Y) to control the ghosts. And another controller to control the player. So essential we made it a 2-player game with one person controlling the pacman and the second person controlling all 4 ghosts.

We were sure that people were going to go crazy figuring out the controls of the game.

Since Halloween was approaching we opted to give our game a thematic look. I created a pixel art characters as you can see below.

We made our pacman Van Helsing lookalike, hence PacVan (our title for the game). Our 4 ghosts were Werewolf, Zombie, Dracula and Ghost (yeah.. simple one).

Each of us designed one level, so in total we got 5 playable levels. The current game is simple and you can get it from here and play.

There are many features like Portal travel, Selective passing, Hide behind Grass, Time trial, etc. We have loads of ideas that can be incorporated in the game and we may implement them in the game some other time.

We got many compliments from players who played the game. It was pretty fun to watch them figuring out the controls and miss the PacVan by moving the wrong ghost.

In conclusion, people who were playing as ghosts won more times than people who played PacVan, despite the obvious fumbling with controls.

It was a great experience for me and I’d love to be part of such events in future as well.

Blender Modeling: Low Poly Water

Hello Blender Folks,

In this tutorial we are going to create Low Poly Water and render it in Cycles Rendering Engine inside Blender. This is what we are going to achieve today:render_result

Open up a new Blender File, i.e the Default Scene with a cube, lamp and a camera as shown below.default_scene

Change to Cycles Render:

Go to the top Menu and change to Cycles Render from the Blender Render.cycles_render_option

Delete the default cube:

Select the Cube and press X or Del key to delete it. You can also delete it from the Outliner Panel. Right click on the cube and select delete option.

outliner

Create a Plane:

Press Shift + A and select Mesh<Plane to add a plane or you can add it from the T Panel’s Create Tab. Rename this plane to “WaterLayer” in the Outliner. It is a good practice to rename your objects in the scene.

Scale the Plane:

Now scale this plane up-to the size of the Grid.

scaled_plane

Subdivide the Plane:

Press Tab key to go into the Edit Mode and then Press W to open up Specials menu and select Subdivide. Now increase the number of cuts to 30 as shown.

subdivide_options

You’d have achieved the following result.

subdivided_plane

Press Tab key once again to exit Edit Mode.

Create a Cloud Texture:

Go to the Texture Tab in the Properties Panel and create a New Texture and change it to Clouds and leave rest of the settings as default.

clouds_texture

Add a Displace Modifier:

Go to the Modifier Tab in the Properties Panel and add a Displace Modifier and then select the Texture that we have just created. Change the Strength value to 0.100.

displace_modifier

You can play around the settings till you are satisfied and get the result something as below.

modified_plane

Duplicate the Water Plane:

Press Shift+D to duplicate the water plane and then press Z and then move it down and scale it a bit till you get something like this.

duplicate_plane

Also don’t forget to rename this new plane to “WaterBed”.

[Optional: Subdivide the WaterLayer plane one more time to get a good view.]

Add Materials to both Planes:

Select WaterLayer plane and go to the Materials Tab. Add a new material. Rename this material to “WaterMaterial”.

Then select WaterBed plane and add a new material for this as well and rename it “BedMaterial”.

Change the setting of both the materials as following.

water_materialbed_material


Change World Settings:

Go to the World Tab and change the color to very light grey or close to white. Make sure  Ambient Occlusion is unchecked.

world_settings

Render:

Now just press F12 key or go to Render Tab and hit Render button. And we will get the following result.

render_result

Disabling Ads in uTorrent

uTorrent is a lightweight torrent client for Windows, Mac, Android and Linux. The application is awesome but sometimes it annoys you with the the sponsored ads that keep showing on the interface.

ads

Now most of us want a clean interface and not boggled down by the ads. So here is what you can do to disable these ads.

  • Go to Preferences in the Options Menu. Or simply press Ctrl + P. This will open up the Preferences dialog box.
  • Go to Advanced tab (choose from left hand side hierarchy) as shown in the following figure. You will see the list of options available in this.preferences
  • Now, enter “offers” in the Filter Tab without the quotes and you will see the list of options that has ‘offers’ keyword included in them.
  • Scroll down and look for the “offers.left_rail_offer_enabled“. You will see that its value is true. search1
  • We want to disable this option so change its value to false and press OK.
  • Similarly, disable “gui.show_plus_upsell” as well. And if you want to close the top ad bar, disable “offers.sponsored_torrent_offer_enabled“.
  • Restart uTorrent.

And voila you can see that the ad box has disappeared. result

Enjoy! 🙂

Blender Tip: Render Border!

Hello Blender Users,

The more experienced Blender users might already be familiar with this tip but the new users would definitely benefit from this tutorial. It is always important to check your materials, textures and lighting while working on your complex scene. And some of the new users would just render the whole scene to check their progress which could be quite taxing for your system (if you are like me and don’t have a high-end beast of a workstation). Nevertheless, it doesn’t hurt if you can save on some processing.

For the sake of this tutorial, I’m using the default scene of Blender.

What we are going to do is use Blender’s inbuilt feature called ‘Render Border‘. To use it follow these steps:

  • Press N on your keyboard to make your N-Panel visible, where you can set the object’s properties and such.n_panel
  • Now tick the Render Border checkbox, (just above the 3D Cursor) as shown in the picture. You can see that after you have marked it, the Viewport got a red dotted border. This enclosed area tells the Blender to render it. But we want to adjust that area, which we will adjust in the next step.n_panel_marked
  • Press Ctrl+B to enable the custom selection to adjust the border. Now you can select the area you desire. I’ve selected the area as shown below. If you want to change your selection again use Ctrl+B.select_border_area
  • Next you need to change the display of the objects in the Viewport Shading from the menu that you can see just below your actual viewport. Select ‘Rendered‘ from the menu as shown.render_mode
  • Now you can observe that only are enclosed in the render border is rendered leaving the rest of the viewport as it is. Even if you rotate your scene or anything it will remain undisturbed.result

Go on now, save some processing and time while improving your productivity. Hope you find this useful.

Till next time!

Radial and Diametric Dimension

Like I wrote yesterday, I finished off the diametric dimension today and sent the PR today which has been accepted and merged.

And right now I’m working on improving them further like snapping the start point, i.e the arrowhead, to the entity (either a circle or an arc).

This will be achieved by calculating the intersecting point on the said entity, which can be the basis for snap-to-entity feature.